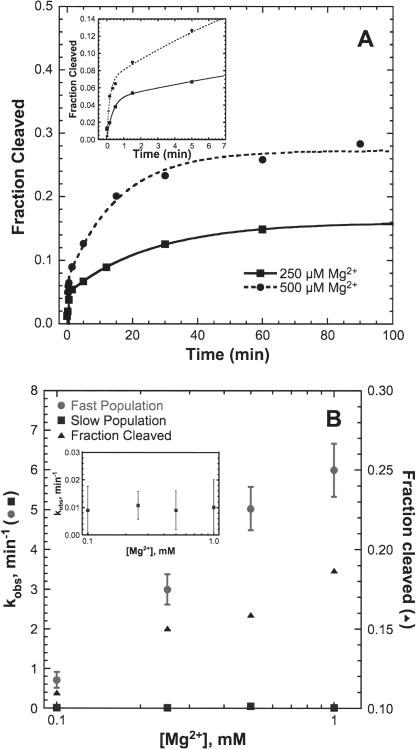
FIGURE 2.
Single-turnover kinetic study of the SL1L2 HHRz. (A) SL1L2 rate curves at 250 (solid line) and 500 (dashed line) μM Mg2+ in 5 mM HEPES (pH 7.0) and 100 mM Na+ fit to a biphasic rate equation (Equation 2). (Inset) Expansion of 0- to 5-min time points. (B) Fraction cleaved (▴) and kobs of slow phase (▪) and fast phase (•) as a function of Mg2+ concentration. (Inset) Expansion of the kobs of the slow phase.

