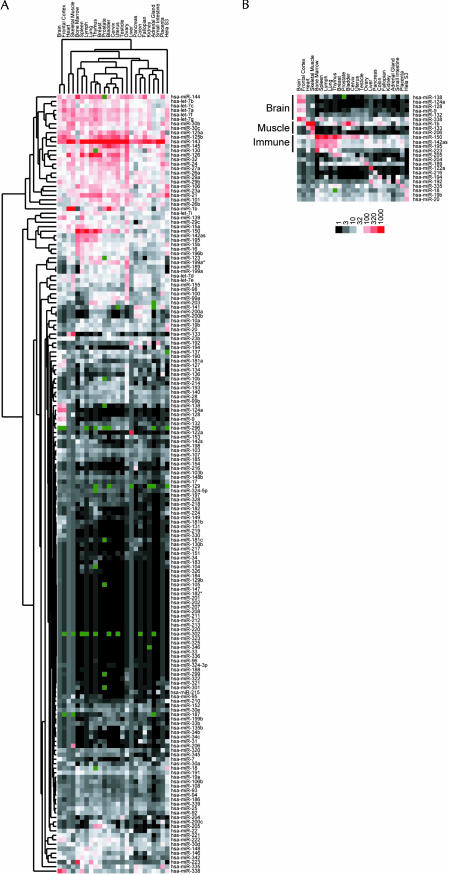
FIGURE 2.
Hierarchical clustering of human miRNAs. (A) Colorgram depicts high (red), average (white), low (black), and absent (dark green) array scores for miRNAs. The highest score was 7095 (miR-143 in Uterus); the average score was 32. The background scores ranged between 0.4 and 3.5; for each tissue, features scoring below the background were set to the level of the background. MicroRNA scores used to generate the colorgram are reported as supplemental data (Supplementary Table 1, http://web.wi.mit.edu/bartel/pub/bartel_publications.html). (B) Examples of miRNAs preferentially expressed in specific tissues. Brain-specific miRNAs, muscle-specific miRNAs, and miRNAs associated with organs of the human immune system are highlighted.

