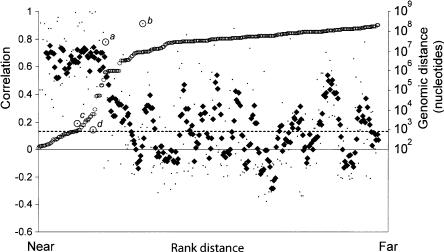
FIGURE 3.
Relationship between the distance separating miRNA loci and their coordinate expression in human tissues. Each of these miRNAs was paired with each of the others lying in the same orientation on the same chromosome. For each pair, the distance between the two loci was ranked, and the correlation coefficient for their expression was plotted according this rank (small points, left axis). A five-point moving average of correlation coefficients is also shown (♦), as are the distances between miRNAs in the human genome (○, right axis), and the average correlation coefficient for all the plotted pairs (dashed line). Outliers discussed in the text are annotated (a–d).

