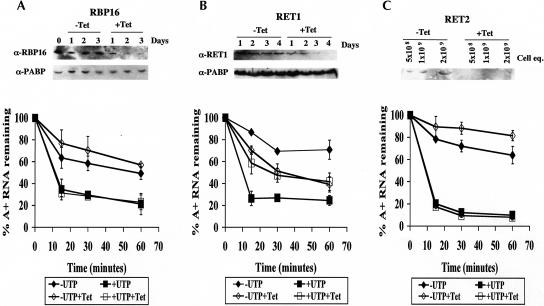
FIGURE 5.
In organello RNA turnover assays with RNAi cells. Mitochondria were isolated from RNAi cell lines: RBP16 (A), RET1 (B), or RET2 (C). Cells were uninduced (closed symbols) or induced with tetracycline (open symbols) for 3 d (RBP16) or 4 d (RET1 and RET2). Isolated mitochondria were labeled with [α-32P]CTP and subsequently incubated in transcription buffer containing 2 mM CTP (-UTP, diamonds) or 2 mM CTP and 2 mM UTP (+UTP, squares). Labeling of polyadenylated RNAs was measured at indicated time points, and percent RNA remaining as compared with pulse-labeled RNA is plotted. Each point is the average of three experiments with error bars representing one standard deviation. Western blots of whole-cell extracts (A,B) or mitochondrial extracts (C) are shown in the top panel of each experiment.

