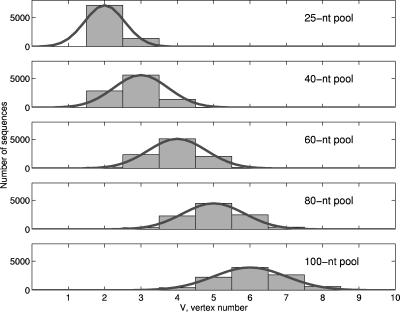
FIGURE 3.
Distribution of structures by vertex number (unfiltered data) and Gaussian fit: 25-nt pool (centered at two vertices), 40-nt pool (centered at three vertices), 60-nt pool (centered at four vertices), 80-nt pool (centered at five vertices), and 100-nt pool (centered at six vertices). See Figure 2 for elaboration of the structures for each vertex number.

