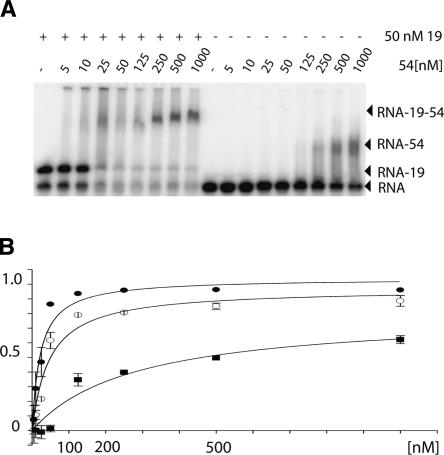
FIGURE 1.
Quantitative analysis of SRP54 binding to 7S RNA. (A) Example of the result from a typical gel mobility shift experiment. (B) Plot of the fractional saturation [7S.S RNA SRP54-bound] / [7S.S RNA total] versus [SRP54]. Mean binding values from independent measurements are shown for the 7S.S RNA–SRP54–SRP19 complex (filled circles), the 7S.S RNA–SRP54–SRP19 double mutant complex (open circles), and the 7S.S RNA–SRP54 complex (squares). The dissociation constant Kd was estimated from the SRP54 concentration at a fractional saturation of 0.5.

