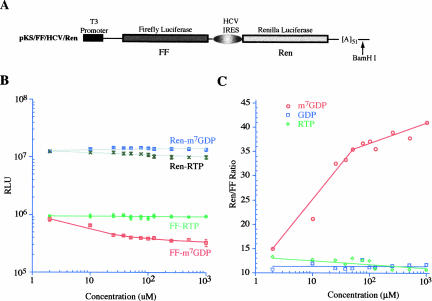
FIGURE 2.
In vitro translations in the presence of RTP, m7GDP, and GDP. (A) Schematic diagram of the pKS/FF/HCV/Ren bicistronic construct. To generate mRNA for in vitro transcriptions, the plasmid was linearized within the 3′ UTR with BamHI. The firefly luciferase coding region is denoted by a blackened box and the Renilla coding region is denoted by a light gray box. The HCV IRES allows for internal initiation and cap-independent translation of the downstream Renilla cistron. (B) Dose response curve illustrating the effect of RTP and m7GDP on translation of FF/HCV/Ren in Krebs extracts. Translations were performed in the presence of the indicated amounts of RTP or m7GDP and at a final mRNA and K+ concentration of 5 μg/mL and 100 mM, respectively. Control translation reactions contained equivalent amounts of vehicle. The obtained luciferase activities for each different mRNA were normalized to the activity obtained in the control translations of the same mRNA species (which was set at one) and plotted as a function of compound concentration. Each data point represents the average of eight independent translations and the standard error of the mean is shown (too small to be seen for many of the data points). Log scale is used on both axes. (C) The relative ratios of Renilla/firefly luciferase values were taken from B and are plotted for each compound as a function of concentration. Included in this panel are the results from a titration performed with GDP as well.

