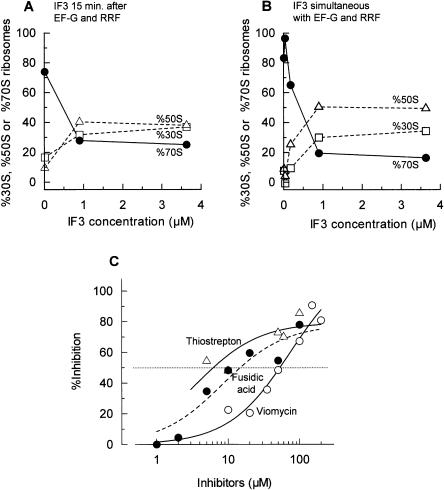
FIGURE 3.
Subunits dissociation from the model post-termination complexes by three factors. (A,B) IF3 dose-response curve. (A) Polysomes (0.6 A260 units) were incubated with puromycin (50 μM), RRF (1 μM), EF-G (1 μM), and GTP (0.36 mM) at 30°C for 10 min in conventional buffer R. Then, IF3 (various amounts) were added and further incubated at 30°C for 5 min. (B) Polysomes (0.6 A260 units) were incubated with puromycin (50 μM), RRF (1 μM), EF-G (1 μM), GTP (0.36 mM), and IF3 (various amounts) at 30°C for 15 min in conventional buffer R. Sedimentation behavior of ribosomes was analyzed as in Figure 1. The percentages of 30S subunits (□, dotted line), 50S subunits (▵, dotted line), and 70S ribosomes (•, solid line) are plotted against added IF3 concentrations. (C) Effects of EF-G inhibitors on the subunit dissociation from the model PoTC by RRF (1 μM), EF-G (1 μM), GTP (0.36 mM), and IF3 (4.5 μM) in conventional buffer R were examined as in B. ○ and solid line, viomycin; ▵ and solid line, thiostrepton; • and dotted line, fusidic acid. Percent inhibition of the increase of subunits was calculated and is plotted against the concentrations of inhibitors.

