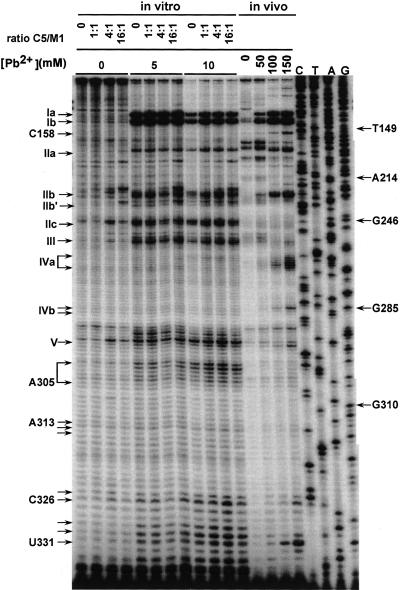
FIGURE 3.
Pb2+ cleavage analysis of M1 RNA in vitro ± C5 protein. Pb2+ concentrations used and protein:RNA molar ratios are indicated. The final concentrations of M1 RNA and C5 protein were 8 nM and 0–112 nM, respectively. Sites of Pb2+ cleavage are denoted as in Figure 1, and are indicated on the left side of the autoradiogram. Primer extensions of an in vivo Pb2+ cleavage analysis using the same radiolabeled primer, M1–2, were run on the same polyacrylamide gel for comparison.

