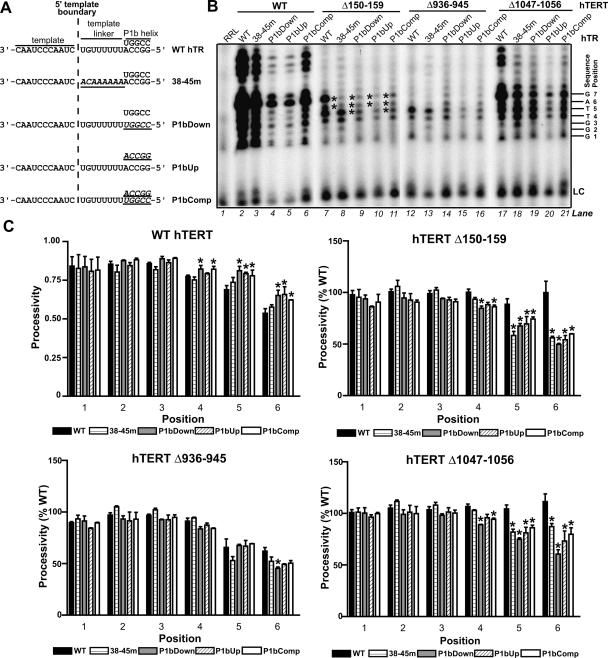
FIGURE 3.
hTR P1b and template linker sequences regulate 5′ template usage in RID1 and C-terminal hTERT mutants. (A) Schematic illustrating substitutions (underlined italicized text) introduced into the indicated hTR mutants. (B) Catalytic phenotypes of hTERT mutants reconstituted with wild-type (WT) hTR and variants and assayed in the absence of dCTP. Asterisks indicate template positions that are reverse transcribed less efficiently when Δ150–159 hTERT is assembled with hTR variants (see C ). The position numbers of each product are indicated at right of the panel. (LC) Loading control. (C ) Nucleotide addition processivities of wild-type hTERT and mutants (as indicated by graph titles) assembled with wild-type hTR and variants (identified in keys), as calculated at each product position. No processivity values are provided for position 7, because position 6 values reflect the processivity between the sixth and seventh product positions (that is, between the last 2 nt reverse transcribed before the 5′ template boundary). The processivity values of each hTERT mutant assembled with wild-type hTR and variants were expressed as a percentage of the processivity values of wild-type hTERT reconstituted with the same hTR (for example, the processivity of Δ150–159 hTERT assembled with 38–45m hTR was expressed relative to the processivity of wild-type hTERT reconstituted with 38–45m hTR). The average of these relative values from two independent experiments is graphically depicted. Asterisks indicate positions at which the mean processivity values for hTERT reconstituted with an hTR variant differed significantly (ρ < 0.05) from the mean processivity value at the same position for the same hTERT assembled with wild-type hTR.

