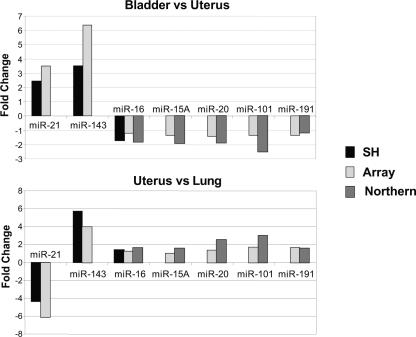
FIGURE 4.
Comparison between miRNA microarray data and other detection methods. Total RNA was isolated from human bladder, lung, or uterus. miRNA populations in 10 μg of each sample were independently fractionated, labeled, and compared by pairs on two separate arrays (162 probes). In parallel, the same total RNA samples were analyzed by solution hybridization (miR-16, -21, and -143, 1 μg total RNA) or Northern blot (miR-15A, -16, -20, -101, and -191, 5 μg total RNA) using 5′-end-labeled RNA probes. The graph shows the calculated absolute fold changes between bladder and uterus (top graph) or uterus and lung (bottom graph) deduced from microarray data analysis (Array) and Northern blot (Northern) or solution hybridization (SH) after quantitation by PhosphorImager.

