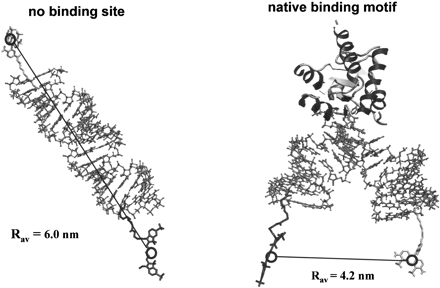
FIGURE 4.
Modeling of the RNA and the fluorophores. To compare the measured distances with model structures, the positions of the fluorophores have to be considered. To account for the positional uncertainty introduced by the length of the linkers, a set of 10,000 possible positions of the fluorophores was calculated by molecular-dynamic simulation, taking only steric hindrance of the RNA into account. To obtain an estimate of the fluorophores’ positions and to compare the modeled structures with the measured distances, the average position for each fluorophore was calculated. The structure of the RNA–protein complex was modeled by elongating the crystal structure of the U4 snRNA k-turn with helical arms.

