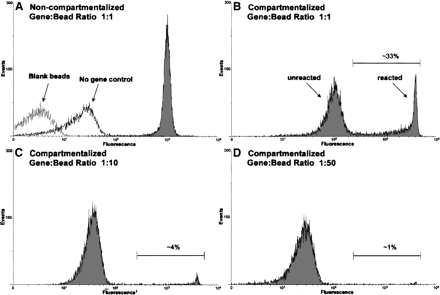
FIGURE 2.
FACS analysis of compartmentalized and noncompartmentalized ligation reactions. Reactions were conducted as described in the text using the b1-207t ribozyme. In the absence of compartmentalization, only a single fluorescent population was observed (A, gray). Compartmentalization resulted in the formation of two distinct populations, a highly fluorescent “reacted” population and a less fluorescent “unreacted” population (B). Decreasing the gene-to-bead ratio (B–D) resulted in a proportional decrease in size of the “reacted” population. The fraction of events that have a fluorescent signal greater than that of the “unreacted” population has been indicated as a percentage. The number of fluorescent events is indicated on the Y-axis and the relative level of fluorescence on the X-axis.

