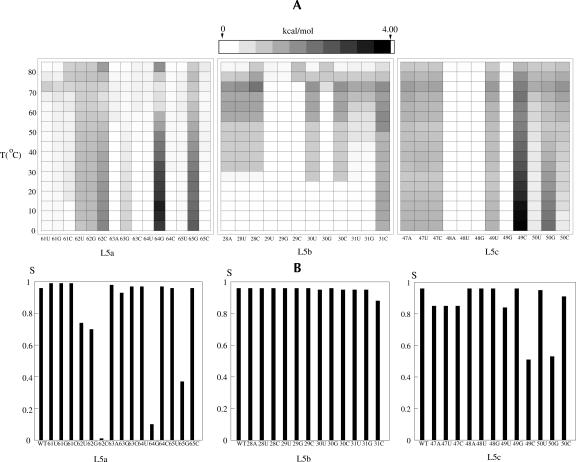
FIGURE 10.
(A) The density plot for the change in the free energy landscape ΔF at different temperatures for different mutations in loops L5a, L5b, and L5c, respectively. The top lines show the color scale. (B) The variations of thermal stabilities at T = 0° C for the wild-type sequence and different mutations in loops L5a, L5b, and L5c, respectively. Loop 5b contains no hotspots of which the mutations can cause drastic changes in the native structure and the stability.

