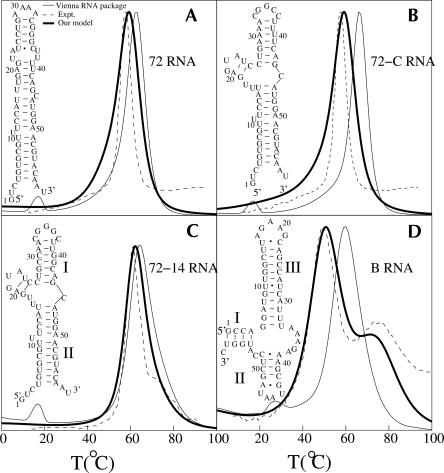
FIGURE 6.
The predicted native structure and the theory–experiment comparisons for the heat capacity melting curves for RNA secondary structures: (A) 72 RNA, (B) 72-C RNA, (C) 72-14 RNA, and (D) B RNA. The experimental melting curves (A–C) are from Gluick and Draper (1994) and (D) from Laing and Draper (1994).

