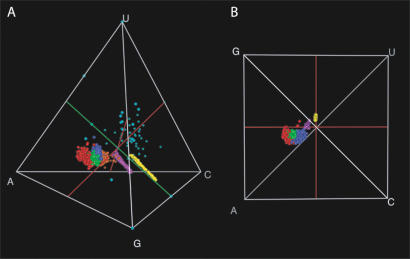
FIGURE 2.
Compositional biases in SSU archaea. The composition space is visualized as a tetrahedron, which can be viewed from many different perspectives. All structural elements have a different color, as defined in Figure 1 ▶. In the oblique view (A), we show the linear distributions along Chargaff’s axis (green line) of the totals and stems. The loops, the bulges, and the junctions are clearly distinct. The ends and the flexible bases contain few bases and are therefore scattered by sampling error throughout composition space. In the other view, down Chargaff’s axis (B), in which the variation in GC content is not visible, we show how constrained all elements are in their variation in the two other directions. This view also emphasizes the purine bias in the totals and the unpaired regions.

