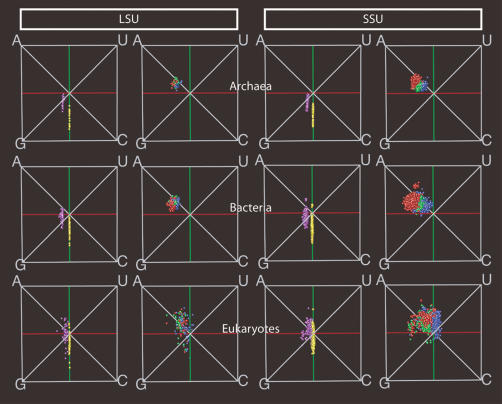
FIGURE 3.
Visual comparisons of sequences from two ribosomal subunits and three domains of life. There is one row for each domain, where we show left to right LSU totals and stems; LSU loops, bulges, and junctions; SSU totals and stems; SSU loops, bulges, and junctions (colors are defined in Fig. 1 ▶). (Top to bottom) The rows show archaea, bacteria, and eukaryotes. The similarities are striking, considering the long time of evolutionary divergence between the different domains.

