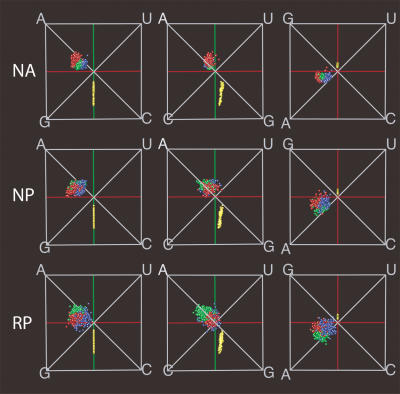
FIGURE 5.
Comparison of the compositional biases found in annotated and predicted structures. The first row shows the annotated structures of natural sequences (NA) in three different perspectives. The second row, used as a benchmark, shows the predicted structures of the natural sequences (NP). The predicted structures of randomized sequences (RP) are shown in the third row. (Colors are defined in Fig. 1 ▶.)

