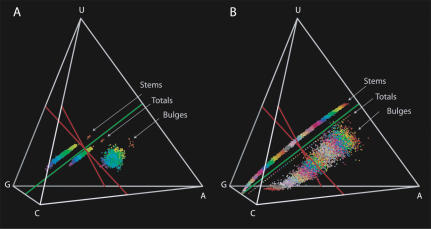
FIGURE 7.
Variation in GC content in natural SSU bacterial sequences (A) and arbitrary sequences with the same composition as the bacteria (B). Sequences with the same color have a similar composition (specifically GC content). In the real SSU bacteria (A), the clusters of sequences with similar overall base composition are recovered as tight clusters in all structural elements (only stems and bulges are shown). The same phenomenon is visible in the arbitrary sequences (B). The totals are tiny dots in the graph, because all 100 random sequences in each interval have the same composition. The GC content in all structural elements is strongly correlated with the GC content in the overall molecule.

