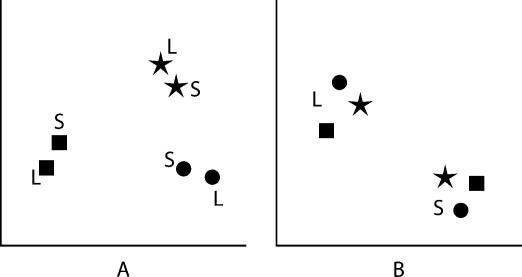
FIGURE 9.
Possible outcomes of data clustering. Symbols represent the base compositions for archaea (squares), bacteria (circles), and eukaryotes (stars) in two dimensions. Letters indicate the ribosomal subunit: large (L) and small (S). Data might be clustered by domain of life (A), where most similarity is within a particular domain and across subunits. In contrast, the subunit might be the most important factor for base composition (B), in which case sequences from the same subunit would be most similar, independent of the domain of life to which the sequences belong.

