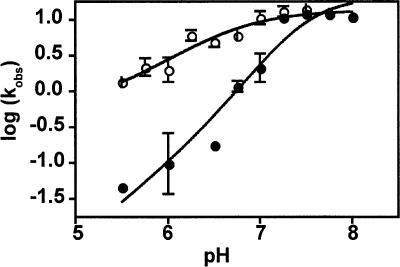
FIGURE 3.
pH-dependence of PT kinetics with Pm and CPm. Observed rate constants for peptide bond formation were measured in the tripeptide assay at 20° C and saturating (10 mM) Pm (closed circles) or CPm (open circles) at pH values between 5.5 and 8. Error bars represent the standard deviation from at least two independent measurements. For Pm, the curve shown is the fit to a model with two ionizing groups whose ionization state contributes to catalysis; for CPm, the curve is the fit to a model with one ionizing group (see Materials and Methods). The slopes of the linear portions of the curves are 1.3 ± 0.1 for Pm and 0.6 ± 0.07 for CPm.

