FIGURE 5.
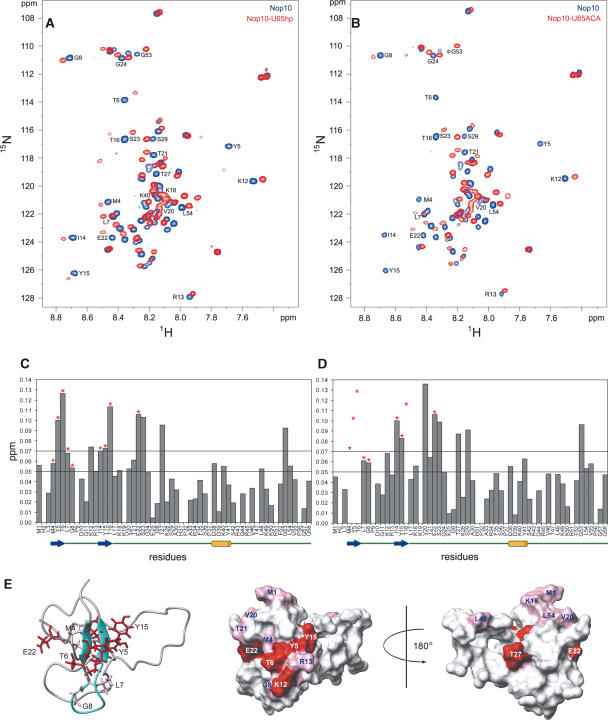
Chemical shift mapping of U65hp and U65ACA on Nop10p. 1H-15N HSQC of free Nop10p (blue) bound to U65hp (red) (A) and U65ACA (red) (B) at a 1:1 ratio of RNA:protein. (C,D) Plots of the chemical shift changes of Nop10p in the presence of U65hp (C) and U65ACA (D). Note that although Y5 is not visible in Figure 5A in the bound form, it is possible to observe the peak at a higher noise level. Asterisks indicate resonances that are exchange broadened in the presence of the RNA. In D some of these are broadened beyond detection and therefore their chemical shift change cannot be quantified. The dashed lines indicate the thresholds used in the surface mapping. A schematic of the secondary structure elements are shown underneath the sequence. (E) The chemical shift changes after the addition of U65hp mapped onto the structure of Nop10p: (Left) Ribbon representation of Nop10p with side chains of residues whose amides are significantly exchange broadened in the presence of U65hp shown; (middle) van der Waals surface representations of Nop10p with all residues that show significant chemical shift changes highlighted in pink (Δppm 0.05–0.07) and red (Δppm >0.07) with same view as ribbon representation; (right) surface representation rotated by 180°.

