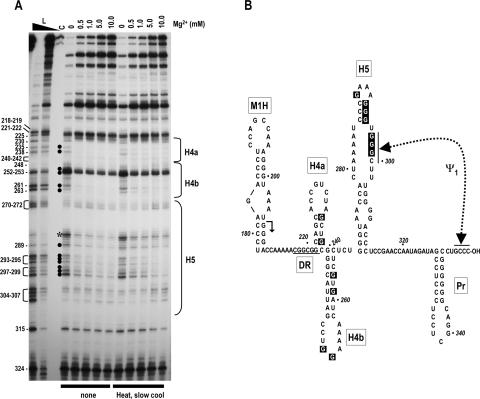
FIGURE 2.
Mg2+ concentration dependence of RNase T1 cleavages in the 3′ region of satC. (A) 3′ end-labeled wild-type satC transcripts were either not treated or subjected to heating/slow cooling and then treated with identical concentrations of RNase T1 in increasing amounts of Mg2+. Mg2+ levels used are shown above each lane. L, RNase T1 ladder produced by cleavage of denatured transcripts. High and low concentrations of RNase T1 are indicated by the closed triangle above the lane. Position of guanylates are given at left. The location of the phylogenetically inferred 3′ hairpins is shown to the right. Filled circles indicate guanylates whose digestion level varies when the Mg2+ concentration increases. Asterisk denotes a nonspecific cleavage of U285. (B) Phylogenetically inferred structure of the 3′ region of satC. Arrow denotes sequence from that location to the 3′ end that is shared with TCV. The DR region (underlined) was previously determined to be important for satC accumulation in vivo and transcription in vitro. Dashed line denotes ψ1, an interaction previously determined to be important for wild-type levels of transcription by the TCV RdRp in vitro (Zhang et al. 2004b). The RNase T1 susceptibility of boxed guanylates varied with increasing concentration of Mg2+.

