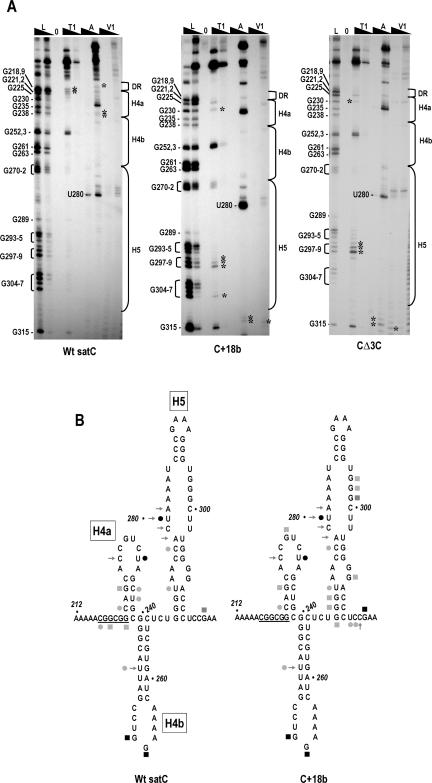
FIGURE 4.
Structural differences between wild-type satC, C+18b, and CΔ3C in the Dr/H4a and H5 regions. (A) SatC, C+18b, and CΔ3C transcripts were subjected to partial treatment with two concentrations of each enzyme. Abbreviations above each lane are as described in the legend to Figure 3 ▶. Guanylate residues in the RNase T1 ladder lane are identified by their positions, as is the prominent cleavage at U280. The boundaries of the H5, H4b, H4a, and DR regions are shown to the right. Asterisks denote cleavages exclusively in wild-type satC or the mutants. Cleavages at G270–272 that were visible using C+18b were also found in some, but not all, gels of wild-type satC. For this reason, they are not marked with asterisks. (B) Reactivity of residues in the DR/H4a/H4b and H5 regions. For convenience, cleavage locations are shown on the phylogenetically inferred satC structure. Symbols are as described in legend to Figure 3 ▶. The DR sequence is underlined.

