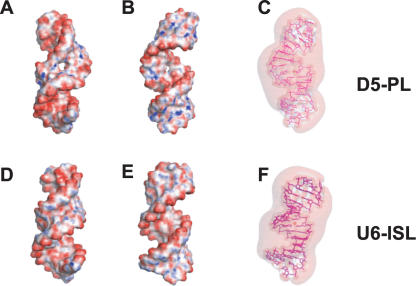
FIGURE 5.
Comparison of calculated molecular electrostatic surface potential and 3D isopotential contours of D5-PL and U6-ISL. Negative surfaces are in red (−25kT), neutral surfaces in white (0kT), and positive surfaces in blue (10kT) for D5 (A,B) and U6 (D,E). The 3D isopotential contours are displayed for D5 (C) and U6 (F) at −1.5kT/e. The major grooves of the tetraloop and the AGC triad regions and the minor groove of the internal bulge are shown for D5 (A) and U6 (D). The major groove of the bulge region and the minor grooves of the tetraloop and the AGC triad regions are shown for D5 (B) and U6 (E). The 3D isopotential contours are displayed from the major groove of the bulge region and the minor grooves of the tetraloop and the AGC triad regions for D5 (C) and U6 (F) at −1.5kT/e. Cavities appear over the minor groove faces of the tetraloop and bulge, and are indicative of likely sites of contact with other RNA elements.

