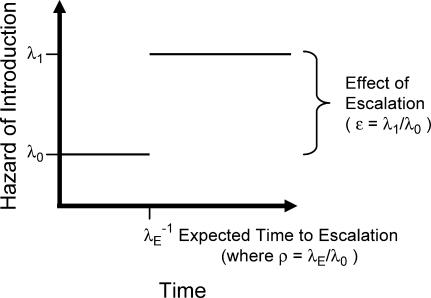
Figure 3. Schematic Diagram of the Escalating Hazard of Introduction Model with Time on the Horizontal Axis and Hazard of Introduction of a Pandemic-Capable Strain on the Vertical Axis.
The initial hazard of introduction (λ 0) increases to a higher hazard of introduction (λ 1) at a rate determined by the hazard of escalation (λ E). The expected time of escalation is the reciprocal of the hazard of escalation. The effect of escalation on the hazard of introduction is measured by the ratio of the final to the initial hazards of introduction (ε = λ 1/λ 0).

