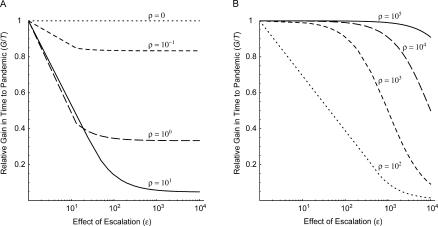
Figure 4. Relative Gain in Time to a Pandemic (G/T) as a Function of the Effect of Escalation on the Hazard of Introduction (ε = λ 1/λ 0) , Assuming Infinite Containment Attempts with 50% Success Probability Are Possible .
Each curve corresponds to a 10-fold increase in the magnitude of the escalation hazard relative to the initial hazard of introduction (ρ = λ E/λ 0) , ranging from 0.1 to 10 (A, short-dashed, long-dashed, and solid lines), and from 100 to 100,000 (B, dotted, short-dashed, long-dashed, and solid lines). When the relative magnitude of the escalation hazard is zero (A, dotted line), the relative gain in time to a pandemic is identical to the simple Poisson process in Figure 2.

