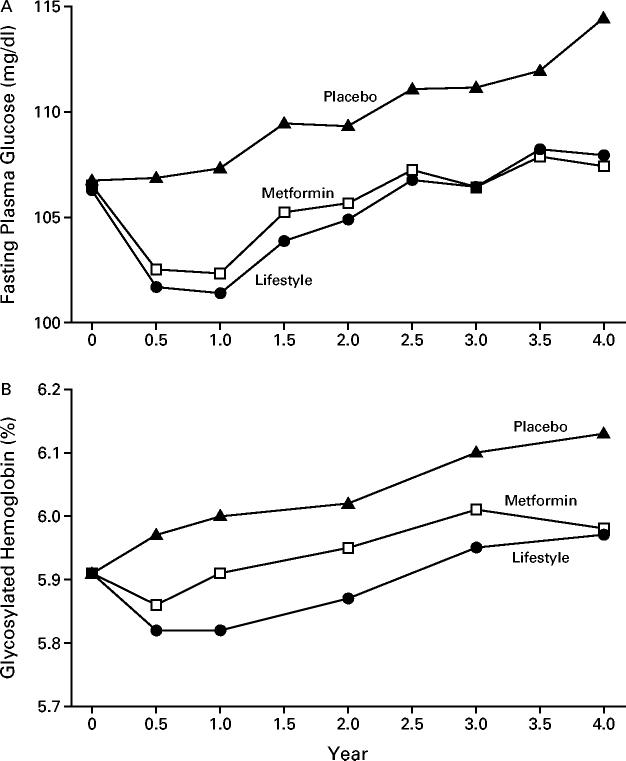
Figure 3.
Fasting Plasma Glucose Concentrations (Panel A) and Glycosylated Hemoglobin Values (Panel B) According to Study Group.
The analysis included all participants, whether or not diabetes had been diagnosed. Changes in fasting glucose values over time in the three groups differed significantly (P<0.001). Glycosylated hemoglobin values in the three groups differed significantly from 0.5 to 3 years (P<0.001). To convert the values for glucose to millimoles per liter, multiply by 0.05551.

