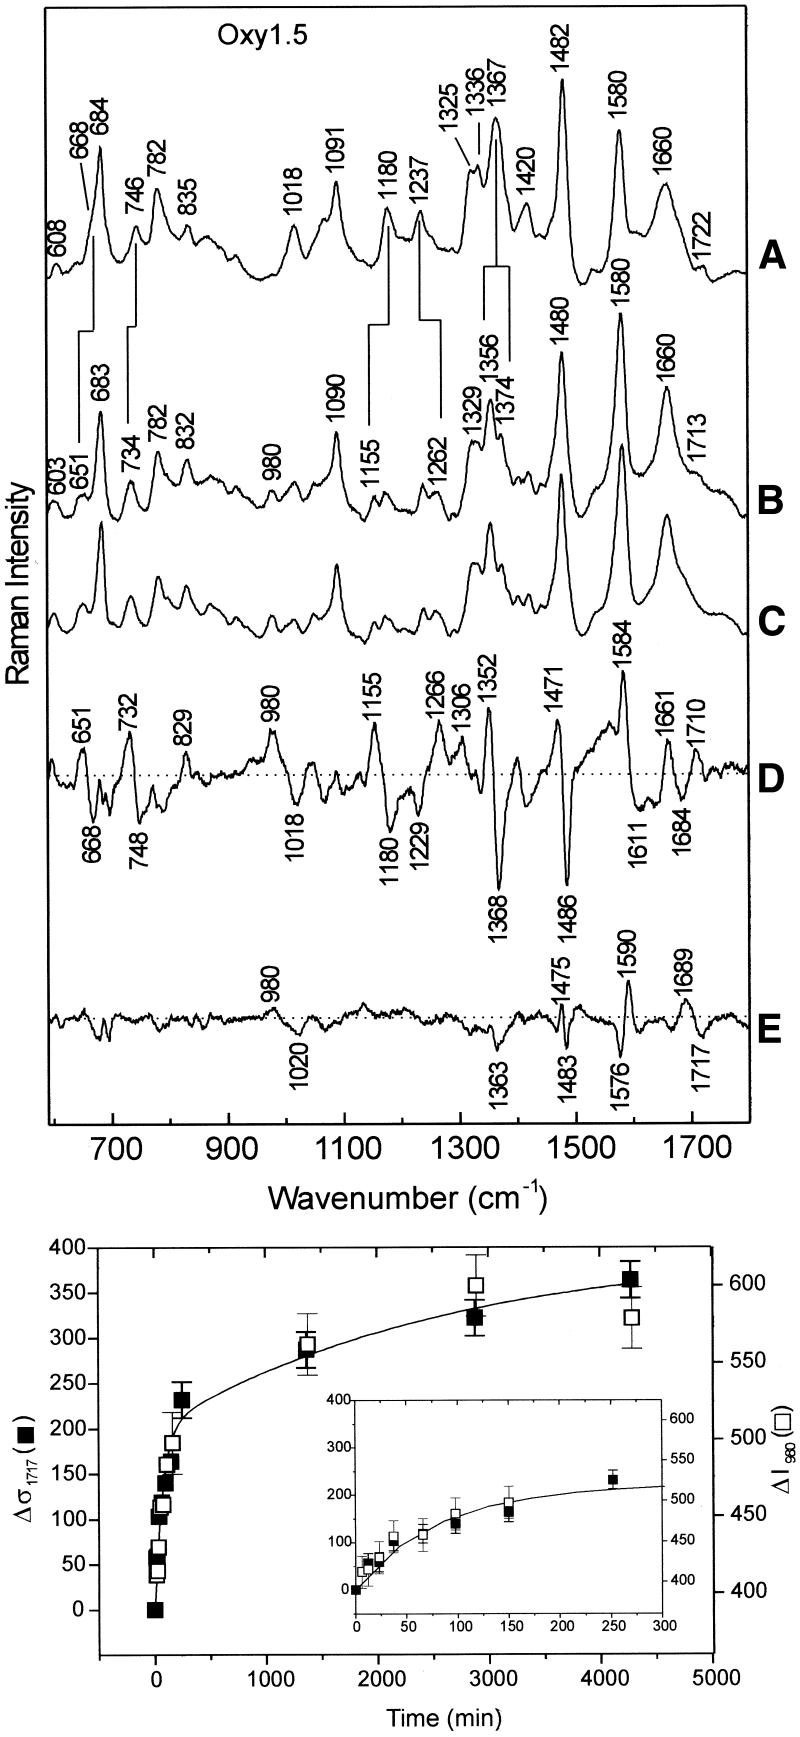
Figure 4.
(Top) Time-resolved Raman spectra (600–1800 cm–1, 532 nm excitation) of guanine exchanges in Oxy1.5 at 20°C. (A) H2O solution (pH 7.5) prior to the onset of exchange; (B) D2O solution (pD 7.5) following 10 min exchange; (C) D2O solution (pD 7.5) following 4320 min exchange; (D) difference (B) – (A); (E) difference (C) – (B). (Bottom) Guanine imino exchange (N1H→N1D) monitored by the downward shift of the 1717 cm–1 marker band, Δσ1717 (filled square), and intensity increase of the 980 cm–1 marker band, ΔI980 (open square), versus time of exchange (t). The results for both markers suggest at least two exchange regimes, each of which is approximated by an exponential fit (line) to the data points. The inset shows the data points over the period 0 < t < 300 min on an expanded scale (see text).

