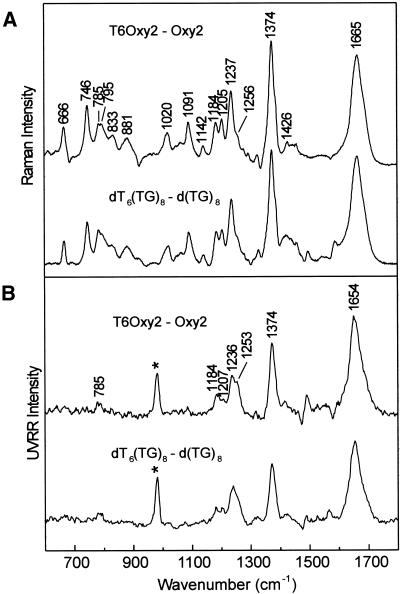
Figure 6.
(A) Raman signatures (10°C) of the thymidine 5′ leader generated by the differences T6Oxy2 – Oxy2 (top trace) and dT6(TG)8 – d(TG)8 (bottom trace). (B) UVRR signatures (10°C) of the thymidine 5′ leader generated by the differences T6Oxy2 – Oxy2 (top trace) and dT6(TG)8 – d(TG)8 (bottom trace). Asterisks indicate uncompensated intensity of the reference intensity standard (981 cm–1 band of SO42–).

