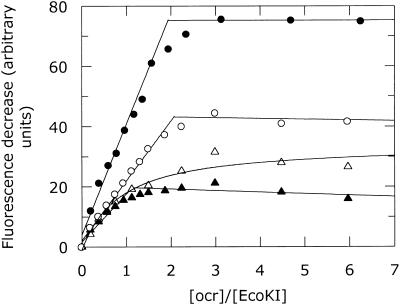
Figure 8.
Change in tryptophan emission intensity at 340 nm upon the addition of ocr to R.EcoKI (filled circle), R subunit (open circle), M1S1 (filled triangle) and M subunit (open triangle). The change in fluorescence is calculated from the sum of the fluorescence of the individual components minus the fluorescence observed from the mixture of the components. The intensity change for R.EcoKI has been scaled by one-third. The stoichiometric end-points for these titrations are given in Table 1.

