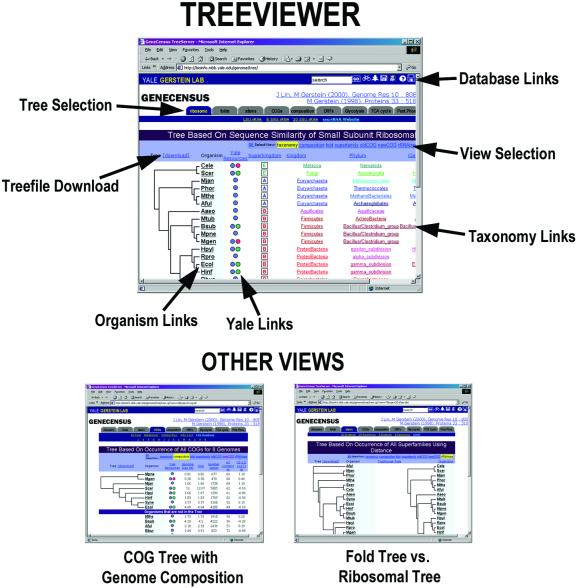
Figure 2.
An annotated close-up of the TreeViewer module. The figure highlights the important parts of the web page format. The top bar, which is maintained throughout the site, provides a search option, a help file and links to PartsList (36), NESGC (41) and Molecular Motions Database (48). To manipulate the view of the data on the web page we provide a menu bar to select which type of tree to view and a second menu bar to determine in which secondary dimension to view the tree. In addition, there are multiple color-coded links next to each organism—green for metabolic pathways, blue for the organism page and red for other Yale pages associated with that organism. For examples of the multiple views, we present a COG tree viewed through genome composition and a fold tree viewed in comparison to the traditional ribosomal tree.

