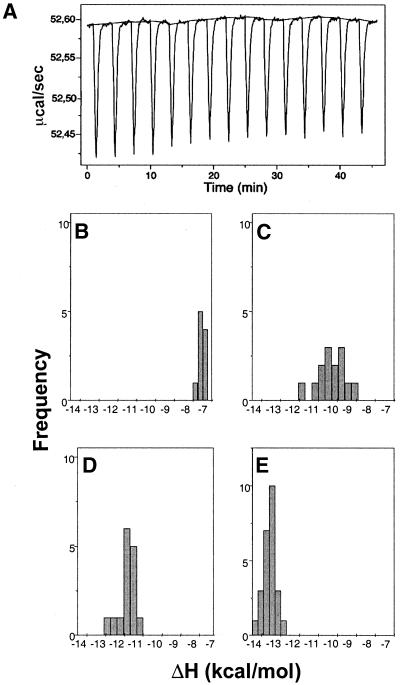
Figure 2.
(A) Representative primary data from an isothermal titration calorimetry experiment, at 30°C, used to obtain multiple estimates of ΔH, in a titration of chartreusin on DNA, using a ‘model-free ITC’ protocol (20) in which a high DNA concentration ensures that all the added ligand is effectively bound. Panels (B)–(E) show the distribution of the DNA-binding enthalpy values for chartreusin, obtained as a function of temperature, at (B) 20°C, (C) 25°C, (D) 30°C and (E) 35°C. The distributions were calculated from three independent ITC analyses at the different temperatures, with 15–25 drug injections in each ITC experiment.

