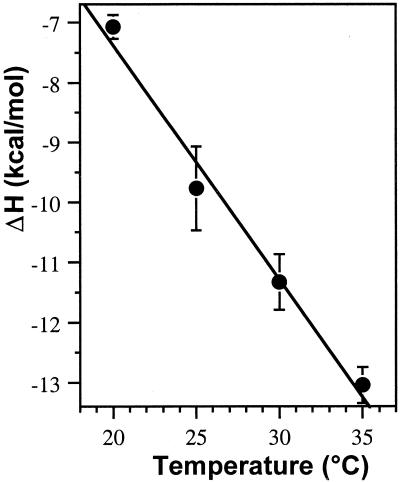
Figure 3.
Temperature dependence of the binding enthalpy of chartreusin– DNA interactions. Data are means ± SD of three independent isothermal calorimetric titrations. The slope of the least squares fit of the data renders the heat capacity change, ΔCp, for chartreusin. See Table 1 for further details.

