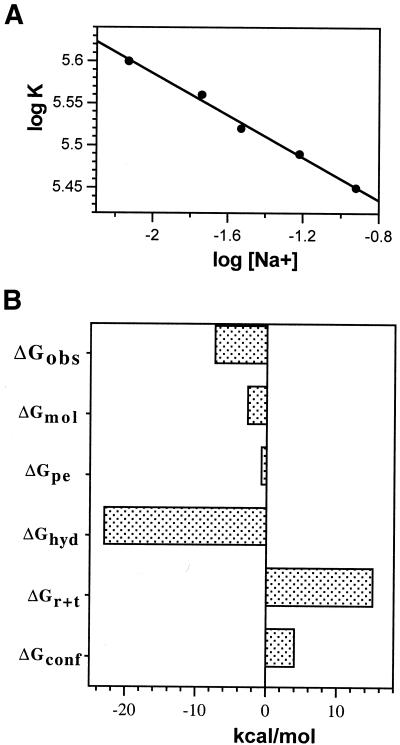
Figure 5.
(A) Salt dependence of chartreusin binding constants at 20°C. Data are presented according to Record’s theory (22). The linear least squares fit to the data yielded a slope of –0.13. From this value, a negligible positive charge of chartreusin is obtained (Z = 0.15), which is not at variance with the expected uncharged molecule at neutral pH. (B) A tentative parsing of the free energy (ΔGobs) of chartreusin binding to DNA at 20°C. The ΔGhyd presented in the figure corresponds to the lower estimate from the equation ΔGhyd = 80 (± 10) ΔCp (30). Details on all the estimated contributions to the free energy are discussed in the main text.

