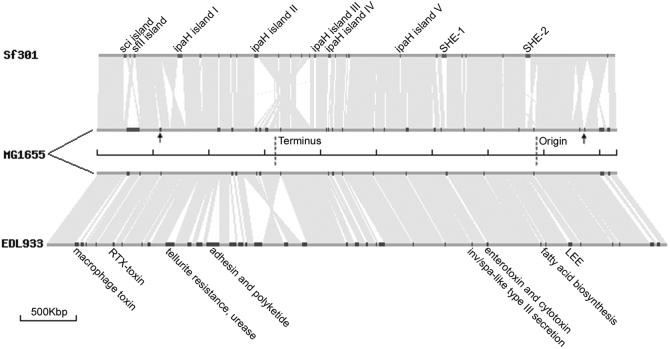
Figure 2.
Schematic representation of translocations and inversions, and strain-specific islands (to scale). Chromosomes are represented by dark gray lines as indicated. Replication origin and terminus of MG1655 are indicated. The respective loci of Sf301 and EDL933 are at approximately the same positions. Regions in light gray indicate homologous sequences between paired chromosomes and triangular non-filling regions indicate the presence of inversions. Translocations are hardly visible because of the scale used. Regions in red, black and blue on the chromosomes represent SI, KI and OI, respectively. The known PAI among SIs and OIs are indicated. SIs with implications for a role in virulence are also indicated. Arrows indicate the KIs harboring ompT (left) and cadA (right) whose deletions are crucial for Shigella virulence.

