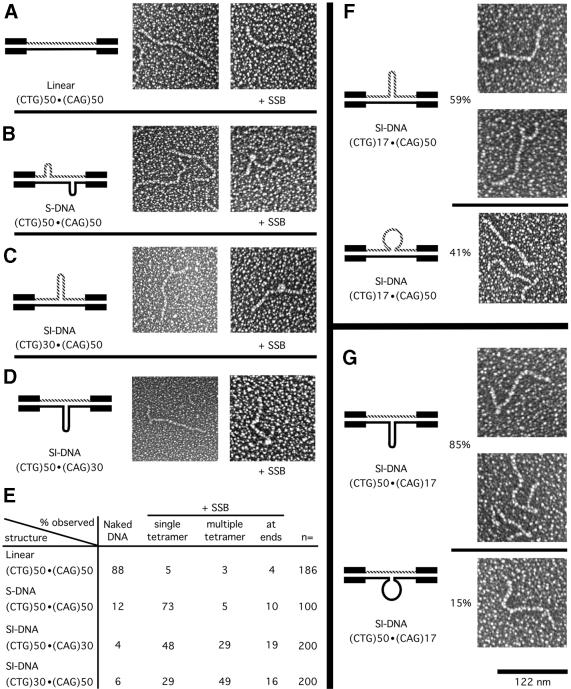
Figure 5.
Electron microscopic analyses of S-DNAs +/– SSB. (A–D) Electron microscopic analyses of gel-purified (CTG)50·(CAG)50 DNAs; linear form (L), slipped homoduplex S-DNAs (S) and the (CTG)50·(CAG)30 and (CTG)30·(CAG)50 slipped intermediate heteroduplexes (SI). The repeat tracts are contained on an NdeI–HindIII fragment which has 265 and 63 bp 5′ and 3′, respectively, of the (CTG)n tract. The left-most panels show schematic representations of the DNA structures, the middle panels show micrographs of the gel-purified naked DNA samples, and the right-most panels show micrographs of the same DNAs in the presence of single-strand binding protein (+ SSB). See text for details. Micrographs are shown in reverse contrast. Size bar in the lower right is 122 nm. (E) Summary of single-strand binding analyses; the qualitative and quantitative analyses of SSB binding were determined and tabulated. (F and G) Electron microscopic analyses of gel-purified sister SI-DNAs (CTG)50·(CAG)17 and (CTG)17·(CAG)50. The repeats are contained on the same NdeI–HindIII fragment as used for (A–D). The magnification for all panels is the same. The left-most panels show schematic representations of the DNA structures. The upper images of (F) and (G) show branched molecules with defined three-way slip-out junction with the slip-out in the hairpin conformation. The lower panels show ‘branchless’ molecules observed in the same gel-purified SI-DNA sample. Both a ‘branchless’ and a ‘branched’ molecule are seen in the lower micrograph of (F). The ‘branchless’ molecules had lengths similar to that of the n = 17 linear form (not shown), which electrophoretically migrated considerably faster than the SI-DNAs. The relative proportion of branched and branchless species in a given sample is indicated.

