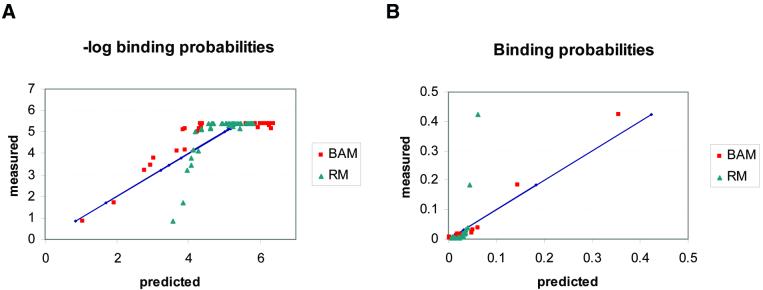
Figure 3.
Probability and log-probability plots. Scatter plots of the negative logarithms (A) and the predicted binding probabilities (B) for the mononucleotide models that provide ‘best fit’ to the data, according to different criteria. The BAM that we calculate in this paper minimises the squared difference between the predicted and the measured probabilities in the data. The regression model (RM) minimises the squared difference between the predicted and the measured log-probabilities of the data (equivalent to energies). This model was calculated using the BLSS package (42) on the normalised average KA values of the wild-type EGR protein. Methods for calculating such regression models also exist in the literature (16,17). The two plots show that BAM is better than RM at predicting the high probability targets, whereas RM better fits the high log-probability ones (equivalent to the high energies). The diagonals (straight lines) correspond to the measured values.

