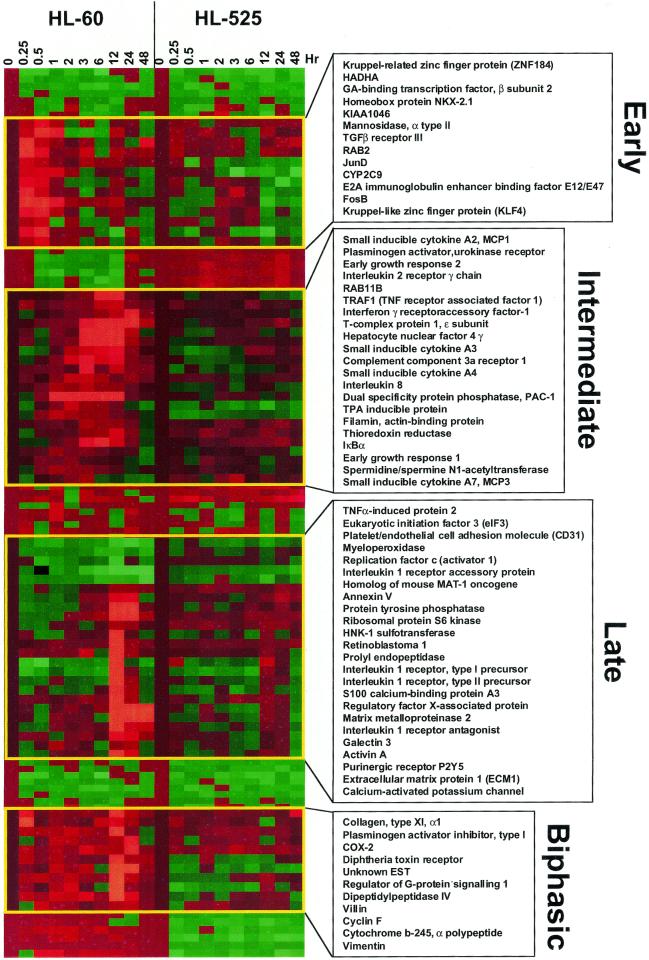
Figure 2.
Cluster analysis of TPA-induced expression profiles of HL-60 and HL-525 cells. Cells were treated with TPA and then harvested at the indicated times for microarray experiments and the expression data were then analyzed by regression models as described in Materials and Methods. Representative clusters of genes were shown in the clustergram for their temporal pattern of expression. Transition of color for each gene from brown to green indicates a gradual decrease in expression with time, and from brown to red indicates upregulation of gene expression.

