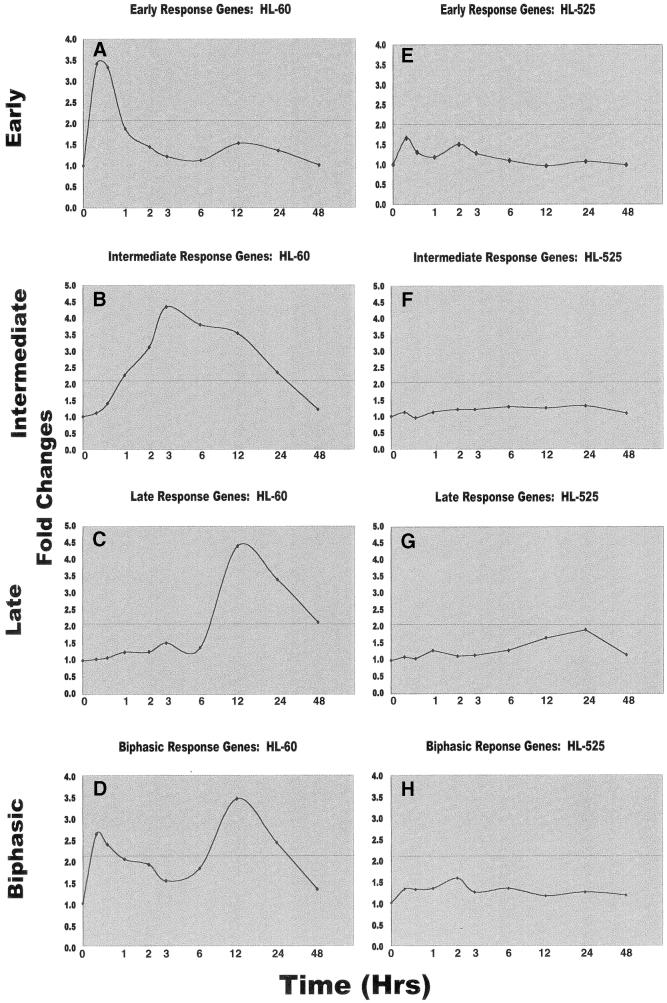
Figure 3.
Effect of TPA on expression profiles of HL-60 and HL-525 cells by regression modeling. For the normalized expression data, regression models were used to fit the polynomial functions relative to the logarithm of time up to the third degree for each gene. A subset of upregulated genes with significant coefficients of the highest degree (i.e. cubic, quadratic or linear) at significance levels of <5% was selected for the HL-60 cells (Fig. 2). These genes are shown in (A)–(D). The effect of TPA on the same genes was also shown for HL-525 cells (E–H). The average fold-changes for the respective cluster of genes were plotted as a function of time in relation to the sequence of their expression. The solid line represents a 2-fold cut-off for the expression levels for these genes. The time points examined in these experiments include 0, 0.25, 0.5, 1, 2, 3, 6, 12, 24 and 48 h.

