
Figure 4.
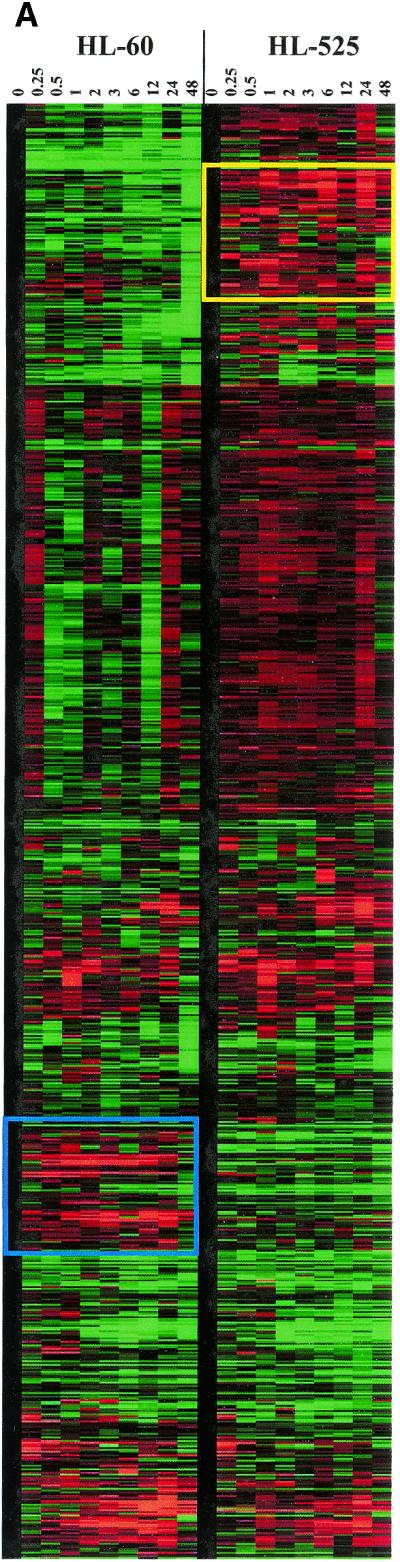

Comparison of the expression profiles between HL-60 and HL-525 cells. (A) Clustergram of all genes examined by microarray in HL-60 and HL-525 cells. The yellow and blue boxes showed clusters of genes uniquely induced in either HL-60 or HL-525 cells, respectively. (B) Clustergram of genes induced in both HL-60 and HL-525 cells. A subset of genes induced by TPA in both HL-60 and HL-525 were subjected to cluster analysis independently. These genes are probably not involved in differentiation. (C) Clustergram of genes induced by TPA in HL-525 but not in HL-60 cells. Comparison of a subset of genes induced by TPA mostly in HL-525 cells, but that was not significantly altered in HL-60 cells, was cluster analyzed independently as above. Red squares represent higher than uninduced control levels of gene expression (upregulation) and green squares lower than uninduced control levels (downregulation).