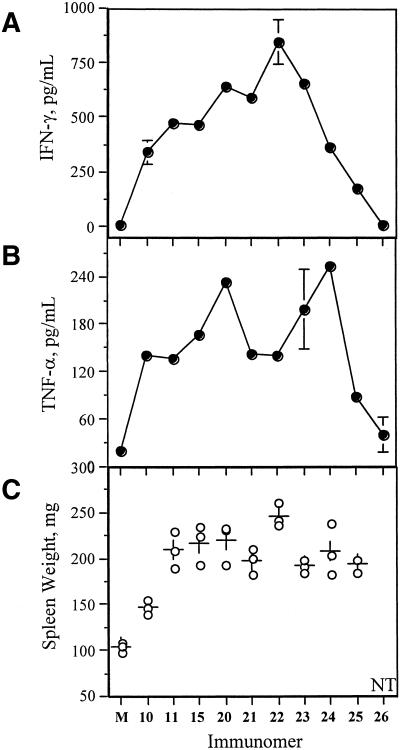
Figure 3.
(A) IFN-γ and (B) TNF-α secretion in BALB/c mouse spleen cell cultures induced by immunomers at a concentration of 1.0 µg/ml. M represents control in the absence of CpG DNA. (C) Splenomegaly in BALB/c mice at a dose of 5 mg/kg dose of immunomer administered SC. Spleen weight of each mouse is represented by open circles. Plus sign indicates average spleen weight. M indicates control mice administered with vehicle (PBS). NT stands for not tested.

