Figure 3.
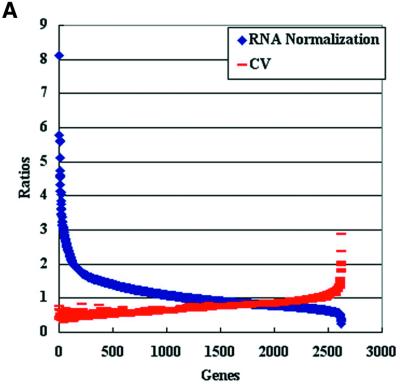
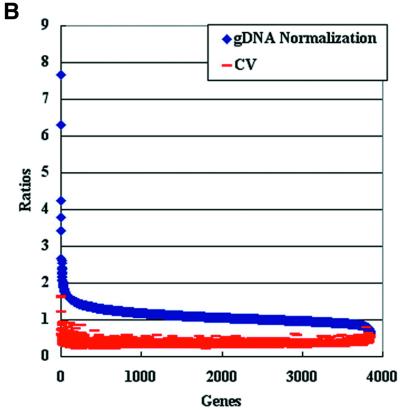
Reproducibility of expression levels of logarithmic phase RNA samples generated by RNA and genomic normalizations. (A) Scatter plot analysis of genes expression levels generated by stationary phase RNA normalization and their corresponding CV values (CV = ratio of the standard deviation relative to the mean hybridization intensities). The signal intensity ratios were sorted from the highest to the lowest (n = 3). (B) Scatter plot analysis of gene expression levels generated by genomic normalization and their corresponding CV values. The signal intensity ratios were sorted from the highest to the lowest (n = 3). Note the number of genes detected by each normalization procedure. Similar results were obtained when the expression levels were measured in the stationary phase RNA samples.


