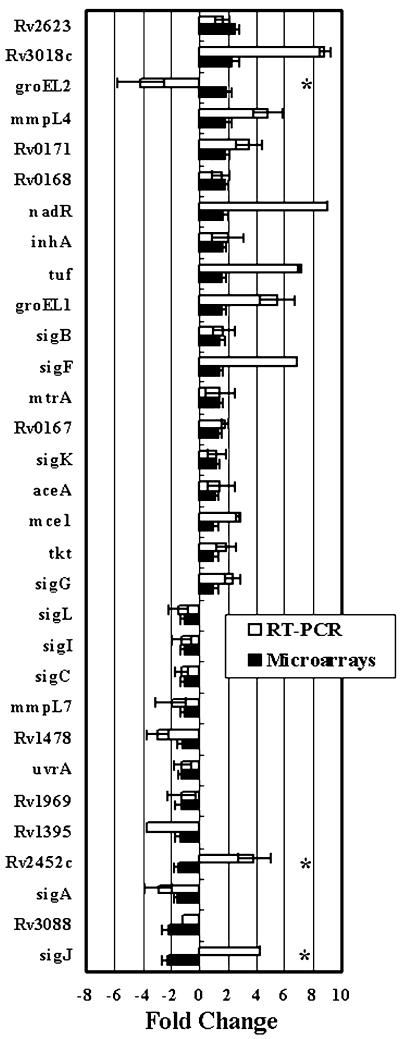
Figure 4.
Comparison between microarray analysis and real time PCR for gene expression profiling. Fold change of genes expressed during M.tuberculosis growth from logarithmic to stationary phases based on the normalized microarray analysis versus real time PCR for a randomly selected set of genes (n = 31). Stars denote genes with disagreement between microarray data and real time PCR.

