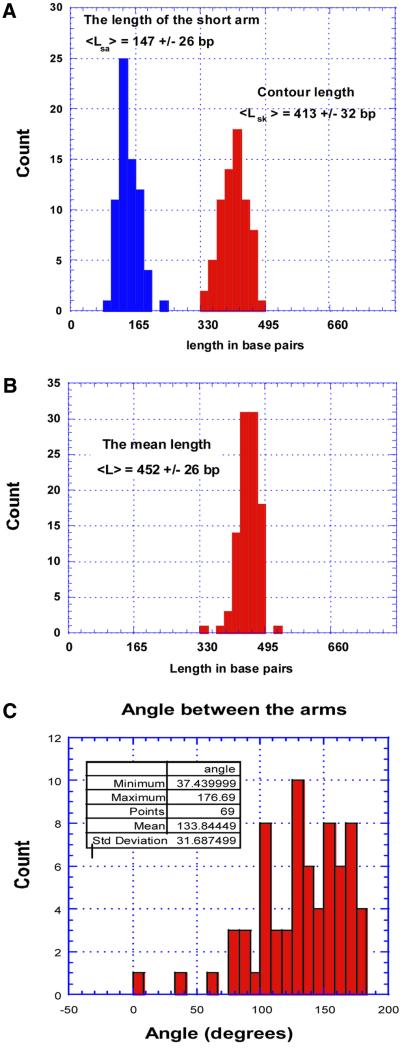
Figure 3.
Data analysis for the 447 bp hemiknot. (A) The histograms for the short end-to-blob contour length distance (the length of the short arm) and the contour length for the entire hemiknot DNA molecule. (B) The contour lengths of the control 447 bp fragment. (C) The distribution of the inter-arm angle (the kink angle) around the blob.

