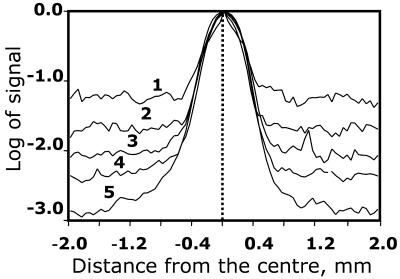
Figure 2.
Comparison of spot profiles for different probe and target concentrations. For each target amount, we prepared an array with 96 blocks containing only one spot per block with 9 mm between blocks. Each curve is an average over the 96 blocks. The maximum values of all curves were normalised to 1. The first curve (1) corresponds to 20 ng/µl spotting concentrations of target and 0.3 ng of probe per 50 ml hybridisation volume; (2) 0.2 ng/µl target, 30 ng/50 ml probe; (3) 20 ng/µl target, 3 ng/50 ml probe; (4) 2 ng/µl target, 30 ng/50 ml probe; (5) 20 ng/µl target, 30 ng/ 50 ml probe. Estimated size of a spot is 350 µm and the distance between spots is 833 µm.

