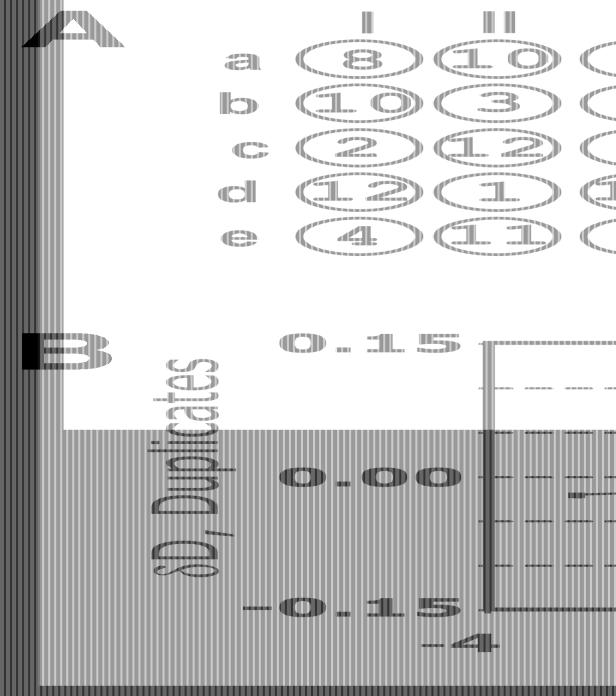
Figure 3.
Calculation of the neighbourhood correction factor. (A) A spotting pattern (similar to Fig. 1) and an image of one of the 96 blocks of the array representing the 12 sequential 2-fold dilution series of target DNA. The image is in a log-transformed form to ensure visualisation of all the spots on the array. (B) A plot of differences between a duplicate (y-axis) versus differences between nearest neighbours of the duplicate (x-axis). All data points were collected from 96 blocks of the array, and the absolute errors derived from the repetitions are shown. The best-fit line is a calculation of the linear regression factor k = (4.2 ± 0.4) × 10–3 corresponding to the neighbourhood correction factor.

