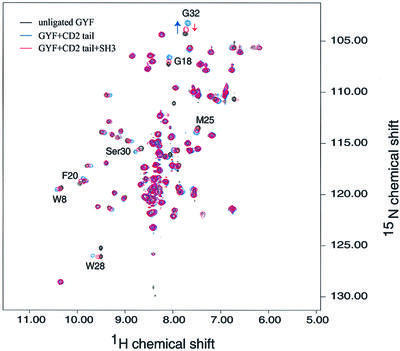
Fig. 6. In vitro competition of CD2BP2 GYF and Fyn SH3 domains for CD2-binding sites. The spectrum of the isolated 15N-labeled GYF domain (0.2 mM) is shown in black. Substoichiometric amounts of the CD2 tail (residues 245–351 of human CD2) were added and the corresponding spectrum is shown in blue. Then 0.4 mM unlabeled Fyn SH3 domain was added, a third spectrum obtained and displayed in red. Residues that are shifted upon binding of the CD2 tail are marked by residue type and number. The arrow for the NH peak of Gly32 clarifies the movement of this resonance.

An official website of the United States government
Here's how you know
Official websites use .gov
A
.gov website belongs to an official
government organization in the United States.
Secure .gov websites use HTTPS
A lock (
) or https:// means you've safely
connected to the .gov website. Share sensitive
information only on official, secure websites.
