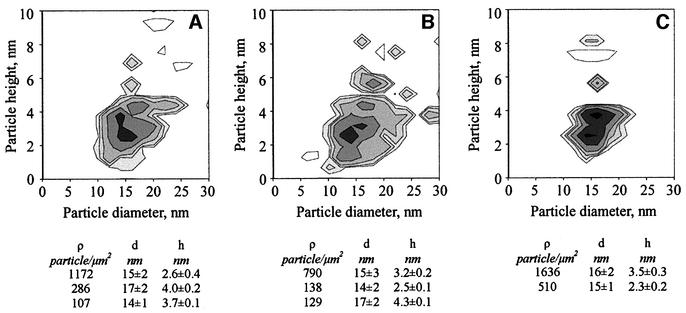
Fig. 2. Distribution of surface particles over different thylakoid domains presented as contour plots of particle size versus height histograms. (A) Stroma lamellae. (B) Grana-end membranes. (C) Grana margins. The contour step is 20 particles/µm2. Histograms were fitted with a sum of Gaussian peaks by least square numerical fitting. Classes of particles assigned as PS I are listed below the frames.

An official website of the United States government
Here's how you know
Official websites use .gov
A
.gov website belongs to an official
government organization in the United States.
Secure .gov websites use HTTPS
A lock (
) or https:// means you've safely
connected to the .gov website. Share sensitive
information only on official, secure websites.
