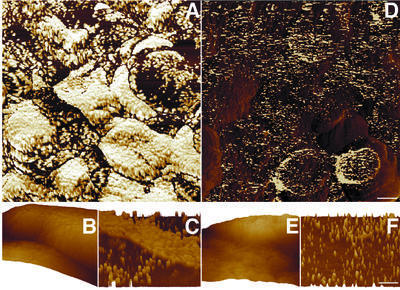
Fig. 3. Surface distribution of immunogold-labelled PS I (A–C) and ATP synthase (D–F) complexes. (A and D) Phase images. (B and E) Three-dimensional renderings. (C and F) Phase images of the areas shown in (B) and (E). Note that the z-axis in the phase images corresponds to a phase shift between the cantilever response and the driving signal, and does not represent the height of the surface. Scale bars: 200 nm in (A) and (D); 100 nm in (B), (C), (E) and (F).

An official website of the United States government
Here's how you know
Official websites use .gov
A
.gov website belongs to an official
government organization in the United States.
Secure .gov websites use HTTPS
A lock (
) or https:// means you've safely
connected to the .gov website. Share sensitive
information only on official, secure websites.
